

In this article
What is an implied volatility surface?
An implied volatility surface organizes IV across strike or moneyness and time to expiry. A smile looks across strikes for one expiry. A term structure compares expiries at a stated reference, such as at-the-money. These are different cuts through the available information.
IV is inferred from an option price through a pricing model. Realized volatility measures historical price variation over a chosen window. They depend on different inputs, so a comparison should identify the lookback, annualization and pricing conventions being used.
For crypto options, begin by checking the asset and contract family. A smooth display can combine quoted inputs with interpolation; its shape alone does not tell you how many usable observations were available.
Read a smile across strikes within one expiry
Hold the expiry fixed and read the horizontal axis. It may show USD strike, moneyness or Delta. Each coordinate selects contracts differently, so the axis definition matters when comparing two charts.
Check the price input behind the IV points. Bid, ask and mark inputs can produce different curves. Missing or thinly quoted wings should remain distinguishable from a well-supported centre, rather than disappearing into an apparently complete line.
If you compare smiles from two sources, retain their observation times and conventions. Otherwise a change in source, reference or input age can look like a change in the smile.
Use a consistent reference for term structure
A term structure holds a reference rule fixed while moving across expiries. Comparing at-the-money IV with at-the-money IV is different from holding a particular USD strike fixed as the forward reference changes.
The reference should therefore be part of the chart description. A change between two expiries can reflect different risk horizons, but the chart by itself cannot identify the event or trading activity responsible for it.
CME’s event-volatility material uses at-the-money and forward at-the-money measures to examine expiry structure. Those are defined measures, not permission to compare arbitrary points from different smiles.
Worked example: an observed point and an interpolated point
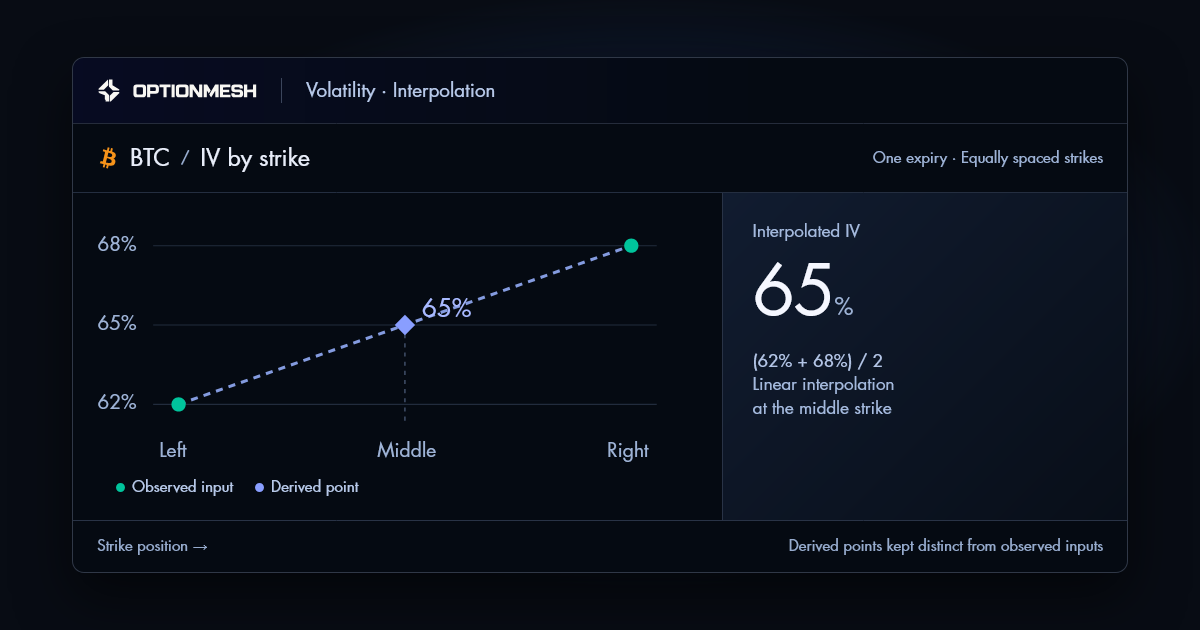
Take two synthetic IV observations at equally spaced outer strikes: 62% on the left and 68% on the right. Under a deliberately simple linear interpolation, the middle strike receives 65% IV.
| Position | IV | Origin |
|---|---|---|
| Left strike | 62% | Observed input |
| Middle strike | 65% | Derived |
| Right strike | 68% | Observed input |
The middle value is (62% + 68%) / 2 = 65% under this example’s assumptions. It does not add a third observed quote. A different interpolation method can produce a different value, and a production surface needs more than this arithmetic to validate its shape.
When reading a surface, look for the input points, the derived area and the missing region. Increasing visual smoothness does not create evidence in a region without qualified inputs.
Check the sign of a 25-delta risk reversal
A risk reversal can summarize the IV difference between a call and a put selected at the same absolute Delta for one expiry. State the subtraction order before interpreting its sign.
In a separate synthetic example, use call IV of 61% and put IV of 58% with a call-minus-put convention. The result is +3 percentage points. Reversing the subtraction produces −3 points from the same inputs.
The Delta convention, source prices and expiry must also match. A two-point measure cannot describe every part of the smile. Here the term risk reversal describes an IV comparison, not an instruction to enter an options position.
What a 3D view adds
A 3D view can make the relationship between strike and expiry easier to inspect. It can also obscure a point behind another part of the surface. Use the axes and point readout to recover the exact coordinate rather than estimating a value from colour or perspective.
OptionMesh includes smile, term-structure and 3D surface demonstrations among its Volatility panels. The demo geometry and sample points explain the views; a current market analysis would still require qualified source observations and a documented surface method.
Questions to keep beside the chart
- Which expiry or reference is fixed, and what does the horizontal axis measure?
- Which option prices and timestamps supplied the IV inputs?
- Can observed inputs, interpolation and unavailable regions be distinguished?
- Is a risk reversal expressed in percentage points with its Delta and sign conventions stated?
References & further reading
- OIC: volatility and the Greeks
- CME: introduction to CVOL skew
- CME: event volatility calculator
- OptionMesh: data, measures and their limits
Examples are educational. An illustrative calculation does not establish production coverage or a trading recommendation.